Surface Finish Chart: The Complete Guide
 Jul 24,2024

Metal surface finish charts are a reference tool used for assuring quality and precision in surface preparation. In addition to physical properties like strength, ductility or toughness etc. surface provides material an overall appearance. A smooth surface finish gives material better fatigue and wear resistance. Roughness is required for applying coating and when friction is needed.
Surface finish chart will help you select the most appropriate and cost-effective way for the desired smoothness. Here, in this article, different surface finish chart is showing comparison of surface roughness with processes, tools and parameters.
Surface Finish: An Overview
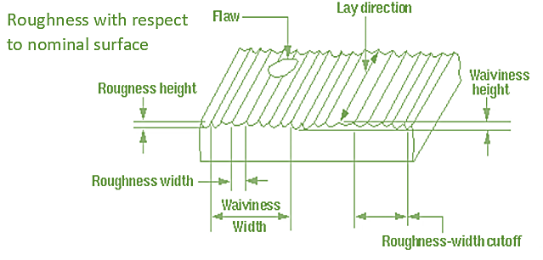
Surface finish also described as surface topography or surface texture, tells you about the nature of surface through these characteristics of surface roughness, lay and waviness. Important factors such as wear resistance, friction and adhesion are influenced by surface finishing of the product.
Importance of Surface Finish Chart in Manufacturing and Engineering
Surface finish charts are used to depict the average roughness profile of a certain material after different processing techniques i.e., grinding, polishing and buffing. By looking at these charts we can choose material and process wisely for getting the desired surface roughness.
Surface finish gives you advantages like increase in performance, durability and corrosion resistance. We can also increase grip and reduce glare by making a textured surface.
With many advantages, it also has some cons like increase in processing cost. It decreases the strength of the material by removal of outermost layer. Rough surfaces can cause material susceptible to corrosion due to increased surface area.
In addition to selecting a process these charts also optimize the process and increase cost efficiency. Surface finishes are arranged according to a standardize way, which also helps in maintain the product quality.
How surface finish is measured
Surface measuring techniques are classified into two broad categories surface comparison methods or non-contact methods. Common techniques that are being used for measuring surface roughness are.
Surface profilometry
Surface profilometry is done to measure surface roughness and thickness of the film. In this technique a diamond tip stylus is move over the surface of specimen.
Scratch inspection
This inspection technique requires a soft material to be moved across the surface of the sample and reveals the scratch pattern over their surface. Materials like lead Babbitt or plastic are used.
Microscopic images
Sample is placed under the microscope and its images are compared with required surface finish images.
Visual inspection
If surface roughness has high value, it can be visually observed and tested. This inspection has limited accuracy. If the roughness decreases illuminated magnifiers are required for the job.
Induction
Digital surface roughness gauge produces output signals through change in inductance in the coils when probe moves along the rough surface.
Laser scanning
Laser confocal microscopes are used for this process. They work in two modes contact and non-contact mode. These microscopes give you horizontal axis measurement and can also do 3D measurement using distant images.
Ultrasonic testing
Ultrasonic sensors can also be used to measure surface roughness. Change in incident and reflected soundwaves is due to surface texture which gives you measurement values.
Classification of Surface Finish Charts
Surface finish is classified into following categories;
Machining surface finish chart
Machining processes like grinding, milling, turning or drilling produce different surface roughness on a specific material after processing. Machine surface finish chart provides you with the comparison of average surface roughness produced by each machining process. This will help you choose the process which gives you desired roughness.
|
Finish Degree (China)
|
ra (um) |
rz (um) |
ra (micro inch) |
Machining Finish Method |
|
1 |
50 |
200 |
2000 |
Rough casting or coarsest machining |
|
2 |
25 |
100 |
1000 |
Rough turning, boring, planning, drilling. Machining marks are obvious |
|
3 |
12.5 |
50 |
500 |
Same as 2-degree finish |
|
4 |
6.3 |
25 |
320 |
Normal turning, boring, planning, drilling, grinding. Marks are visible |
|
250 |
||||
|
5 |
3.2 |
12.5 |
200 |
Same processes like 4 degrees but Machining marks are somewhat visible |
|
160 |
||||
|
125 |
||||
|
6 |
1.6 |
6.3 |
100 |
These processes are used: Number controlled turning, boring, planning, drilling, grinding. Machine marks are not visible but directions are |
|
80 |
||||
|
63 |
||||
|
7 |
0.8 |
6.3 |
50 |
Same processes like degree finish 6. But directions are blur |
|
40 |
||||
|
32 |
||||
|
8 |
0.4 |
3.2 |
25 |
Processes like Reaming, grinding, boring, rolling makes surface for smooth but marks direction is blur |
|
20 |
||||
|
16 |
||||
|
9 |
0.2 |
1.6 |
12.5 |
Grinding, super machining makes marks and their direction invisible |
|
10 |
||||
|
8 |
||||
|
10 |
0.1 |
0.8 |
4 |
Further super machining produces highest finish of surface dark gloss |
Surface finishes and roughness number of samples through different process of horizontal milling, turning and vertical milling are compared in the chart below.
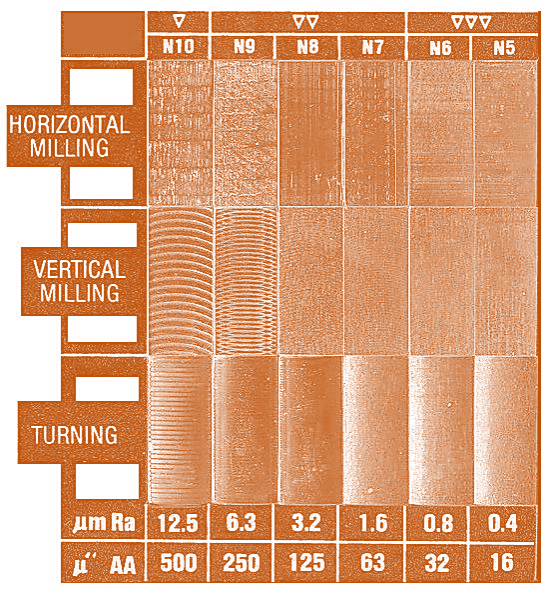
These samples have different patterns on their surface due to dissimilar processing tools, still they lay in same roughness number because their average roughness is similar.
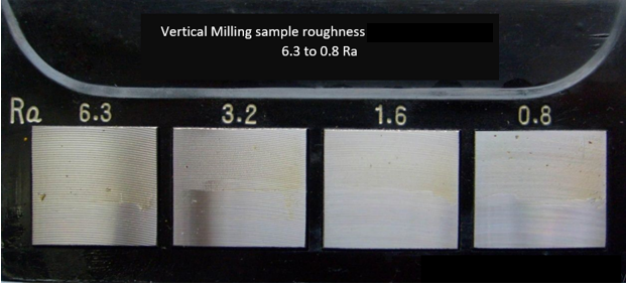
Milling surface finish chart
Unlike machining surface chart, milling surface chart main focus is on the milling process. It compares average surface roughness produced by different cutting tools, cutting speed and feed rates. So, if you are only given the choice of doing milling process, by taking a look at this surface finish chart you can optimize the process.
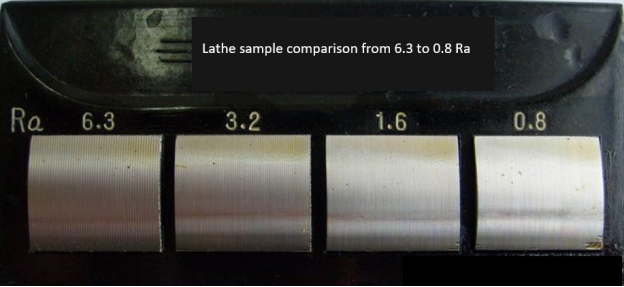
Lathe surface finish chart
Lathe surface finish chart shows ranges of surface roughness resulted from different materials and cutting parameters. If you are a machinist or an engineer these charts will help you choose the best lathe settings to get the desired texture on the surface of a certain material.
Plastic surface finish chart
A plastic finish chart gives you the contrast between different finishes, their roughness range and cost of achieving the finish. Then plastic materials are compared for the desired roughness, for example most suitable material for A1 highly glossy surface (having minimum roughness) is acrylic polymer. Polypropylene and Polyurethane are not suitable for glossy surface finish.
Different plastics and their suitability for A1, A2 and A3 super glassy surface finishes is given.
|
Polymers |
A1 |
A2 |
A3 |
|
ABS |
Average |
Average |
Good |
|
Polypropylene (PP) |
Poor |
Average |
Average |
|
Polystyrene (PS) |
Average |
Average |
Good |
|
HDPE |
Poor |
Average |
Average |
|
Nylon |
Average |
Average |
Good |
|
Polycarbonate (PC) |
Average |
Good |
Excellent |
|
Polyurethane (TPU) |
Poor |
Poor |
Poor |
|
Acrylic |
Excellent |
Excellent |
Excellent |
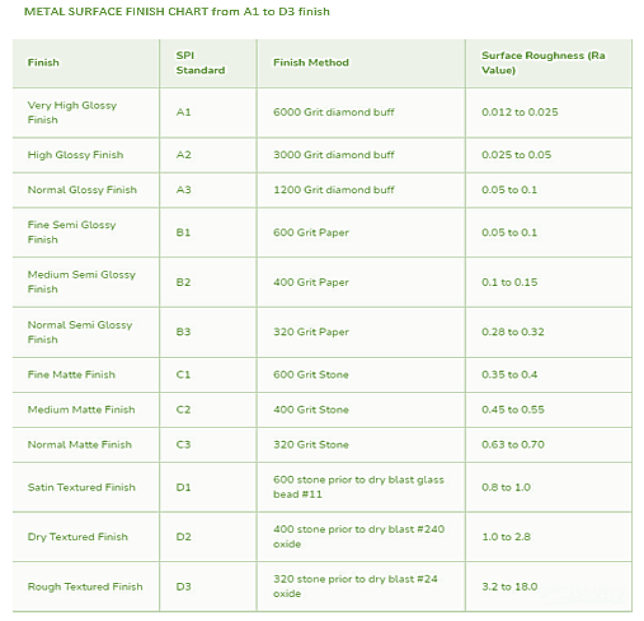
Metal surface finish chart
Metal surface finish chart provide a combined comparison between surface roughness of different metals after using different machining processes like grinding, milling etc. It also helps in optimizing. These charts are more about finishing processes related to materials unlike machining charts which provides comparison of all machining processes.
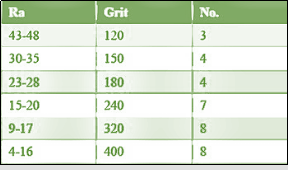
Stainless steel surface finish chart
A simple stainless steel surface finish chart shows you average roughness, grit and polish number. Grit and polish number are based on the process our materials used for providing surface finish. Polish number ranges from 1 to 8, 1 is non polished and 8th has the lowest roughness number. These surface finishes are produced using string wheels which has a layer of abrasive material having a specific grit number.
Surface finish conversion chart
Different industries use different standardize units of surface roughness. This chart will help you to understand surface finish charts used by different industries in other countries. Conversion between following units is done:
Ra = Roughness Average in micrometers or microinches.
RMS = Root Mean Square in microinches.
CLA = Center Line Average in microinches.
Rt = Roughness Total in microns
N = New ISO (grade) scale numbers.
Cut-off Length = Length required for sample.
|
N |
Ra |
Rz |
CLA |
RMS |
Cut off length |
|
|
Inches |
mm |
|||||
|
1 |
0.3 |
0.025 |
1 |
1.1 |
0.003 |
0.08 |
|
2 |
0.5 |
0.05 |
2 |
2.2 |
0.01 |
0.25 |
|
3 |
0.8 |
0.1 |
4 |
4.4 |
0.01 |
0.25 |
|
4 |
1.2 |
0.2 |
8 |
8.8 |
0.01 |
0.25 |
|
5 |
2.0 |
0.4 |
16 |
17.6 |
0.01 |
0.25 |
|
6 |
4.0 |
0.2 |
32 |
35.2 |
0.03 |
0.8 |
|
7 |
8.0 |
1.6 |
63 |
64.3 |
0.03 |
0.8 |
|
8 |
13 |
3.2 |
125 |
137.5 |
0.1 |
2.5 |
|
9 |
25 |
6.3 |
250 |
275 |
0.1 |
2.5 |
|
10 |
50 |
12.5 |
500 |
550 |
0.1 |
2.5 |
|
11 |
100 |
25 |
1000 |
1100 |
0.3 |
8.0 |
Understanding the Different Types of Surface Finish Charts
Bead blast surface finish chart
Bead blasting is done by targeting glass or steel beads at high pressure on to the surface of material being prepared. It provides average roughness of 42 Ra (micro-inch). A typical bead chart provides you with the contrast in roughness values using different bead size and materials. Pressure and nozzle distance can also be added in the chart to optimize the surface finishing.
|
Grade |
Surface Roughness |
Appearance |
Applications |
|
Grade 1 |
Very Fine Bead Blasting |
Smooth |
Cosmetic parts, medical equipment |
|
Grade 2 |
Fine Blasting |
Low Texture |
Aerospace components |
|
Grade 3 |
Medium Blasting |
Moderate Texture |
Automotive parts, Machinery |
|
Grade 4 |
Coarse Blasting |
Rough texture |
Marine components |
Coating Thickness Chart
This chart recommends you different desired coating thicknesses or types on a certain material. Coating thicknesses are expressed in many units such as micrometers, millimeters, mils (thousands of an inch) or microinch. So, if you have to apply coating in different units, then this chart will save your time [15]. These charts are important in industries such as paint, corrosion protection, quality control etc. [14].
|
μm |
mm |
inch |
mils (thousand of an inch) |
Tenths (of of an inch)
|
Millionths (one Millions of an inch) |
|
1 |
0.1 |
0.0001 |
0.000004 |
0.004 |
0.04 |
|
2 |
0.5 |
0.0005 |
0.00002 |
0.02 |
0.2 |
|
3 |
1 |
0.001 |
0.000039 |
0.039 |
0.39 |
|
4 |
1.5 |
0.0015 |
0.000059 |
0.059 |
0.59 |
|
5 |
2 |
0.002 |
0.000079 |
0.079 |
0.79 |
|
6 |
2.5 |
0.0025 |
0.000098 |
0.098 |
0.98 |
|
7 |
3 |
0.003 |
0.000118 |
0.118 |
1.18 |
|
8 |
3.5 |
0.0035 |
0.000138 |
0.138 |
1.38 |
|
9 |
4 |
0.004 |
0.000157 |
0.157 |
1.57 |
|
10 |
4.5 |
0.0045 |
0.000177 |
0.177 |
1.77 |
|
11 |
5 |
0.005 |
0.000197 |
0.197 |
1.97 |
|
12 |
5.5 |
0.0055 |
0.000217 |
0.217 |
2.17 |
|
13 |
6 |
0.006 |
0.000236 |
0.236 |
2.36 |
|
14 |
7 |
0.007 |
0.000276 |
0.276 |
2.76 |
|
15 |
8 |
0.008 |
0.000315 |
0.315 |
3.15 |
|
16 |
9 |
0.009 |
0.000354 |
0.354 |
3.54 |
|
17 |
10 |
0.01 |
0.000394 |
0.394 |
393.7 |
|
18 |
12 |
0.012 |
0.000472 |
0.472 |
4.72 |
|
19 |
15 |
0.015 |
0.000591 |
0.591 |
5.91 |
|
20 |
20 |
0.02 |
0.000787 |
0.787 |
7.87 |
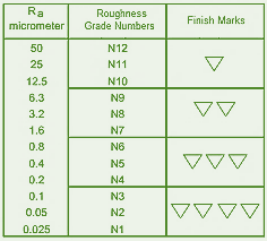
Finish Quality Chart
Finish quality chart shows you a range of surface finishing from unpolished to buffed polish (highly reflective) surfaces and their surface roughness values in micrometer(µm) or microinches(µin). These sometimes contain images of the surface of finish materials. Following chart has different grade numbers and marks for roughness numbers.
Tooling Chart
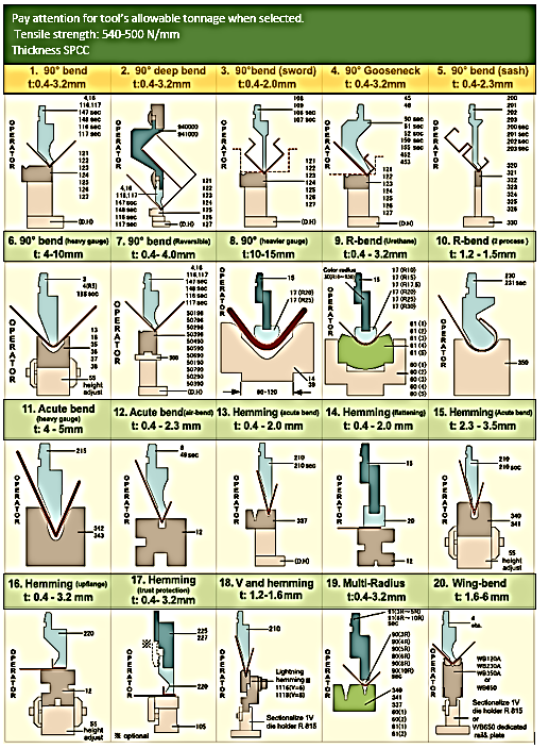
Tooling chart gives you information about several tools being utilized in industry. Its major sections are tool type, tool size, feeding rates or materials [16]. It increases process efficiency and also reduces material wastage by using right tool for the job. So, it will save you money and time.
Surface finish symbols chart
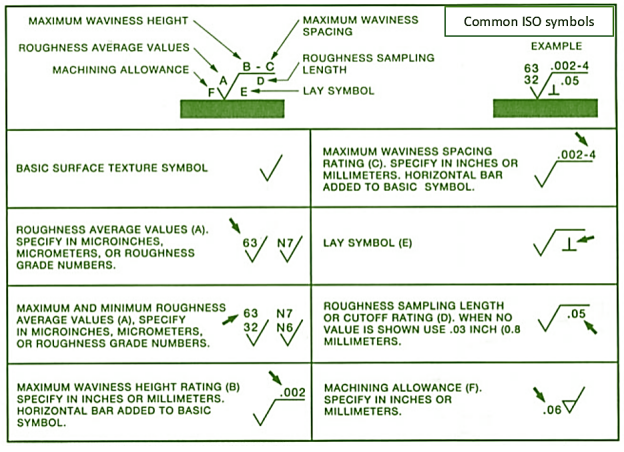
ISO surface finish symbols
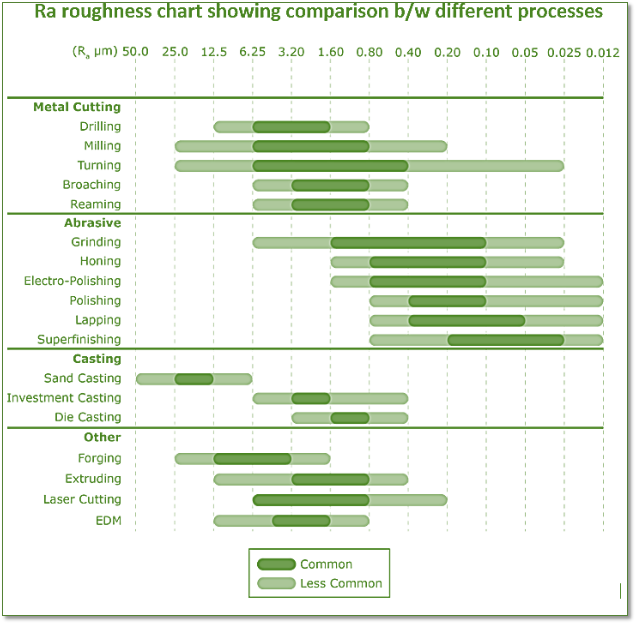
Ra roughness chart
ra is average roughness value it is used to measure average of standard deviation from a mean line. It can be represented in terms of µm or µin. It also displays surface finishes along with ra roughness value. By looking at the average roughness of a surface finish you can select materials requiring certain friction, sealing capabilities and aesthetic look.
Rz surface roughness chart
rz is known as depth roughness. It is calculated by finding average distance between highest and lowest peak. rz surface roughness chart also displays different textured surfaces along with rz values. It tells you about material wear resistance and how it can hold a lubricant.
|
Finish Degree
|
rz (um) |
Machining Finish Method |
|
N12 |
200 |
Rough casting or coarsest machining |
|
N11 |
100 |
Rough turning, boring, planning, drilling. Machining marks are obvious |
|
N10 |
50 |
Same as 2-degree finish |
|
N9 |
25 |
Normal turning, boring, planning, drilling, grinding. Marks are visible |
|
N8 |
12.5 |
Same processes like 4 degrees but Machining marks are somewhat visible |
rms surface finish chart
In rms surface finish chat surface roughness is expressed as rms (root mean square). It has similar units µm or µin. This chart also gives an idea about material fatigue life.
|
Finish Degree
|
rms |
Machining Finish Method |
|
N12 |
55 |
Rough casting or coarsest machining |
|
N11 |
27.5 |
Rough turning, boring, planning, drilling. Machining marks are obvious |
|
N10 |
13.75 |
Same as 2-degree finish |
|
N9 |
9.13 |
Normal turning, boring, planning, drilling, grinding. Marks are visible |
|
N8 |
3.52 |
Same processes like 4 degrees but Machining marks are somewhat visible |
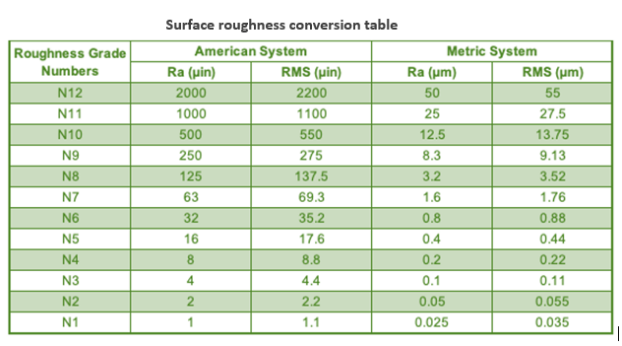
Surface roughness chart conversion
This chart converts surface roughness into many units. This helps you to choose the standard unit which an industry is using. Following formulas are used to convert these units
- Micrometers (µm) to Microinches (µin): Microinches (µin) = Micrometers (µm) x 39.3701
- Micrometers (µm) to Millimeters (mm): Millimeters (mm) = Micrometers (µm) / 1000
- Microinches (µin) to Micrometers (µm): Micrometers (µm) = Microinches (µin) / 39.3701
- Microinches (µin) to Millimeters (mm): Millimeters (mm) = Microinches (µin) / 39,370
- Millimeters (mm) to Micrometers (µm): Micrometers (µm) = Millimeters (mm) x 1000
- Millimeters (mm) to Microinches (µin): Microinches (µin) = Millimeters (mm) x 39,370
A chart as an example is given below under surface roughness conversion chart table [1].
Factors Affecting Surface Finish
Some of the most important factors that you should keep in mind are;
Cutting tool material
Cutting material type which you are using also effects surface roughness for example high speed steel tools produces more roughness on surface whereas carbide and ceramic tools give you smooth surface.
Material hardness
If material hardness is close to the hardness of the cutting tool surface roughness would be higher. So greater is the hardness gap between two material and tool smoother will be the surface.
Machining parameters
Machining parameters such as cutting speed, depth of cut, feed and rate by which material is removed. These parameters can be altered to have desired surface roughness.
Lubrication and cooling
Lubrication or other cooling processes reduce friction and also saves tool from damage and provide neat surface finish.
Post processing treatments
After machining additional processing like chemical treatment, grinding and polishing is done to further increase the smoothness of surface.
Surface Roughness Conversion Chart Tables
Following table shows roughness conversion into different units.
Surface finish is checked with
Surface finish is checked with profilometers and different techniques stated above. Profilometers contain a stylus which moves over the surface of material and calculate the roughness depth.
Conclusion
Surface finishing is not only done to make a product aesthetically pleasing. A good surface finish can improve material fatigue resistance. Many types of surface finish charts are discussed in this article which gives you an idea about the range of surface roughness obtained through different processing types and tools.
Surface finish charts save your time in finding the superior process and tool for desired surface roughness. Ways to calculate surface roughness are also added which will help you in making charts. You can make custom charts according to your need using standard units.
For further learning and exploration, you can check international organization of standardization (ISO). There are standards related to surface roughness and texture calculation such as ISO 4287, ISO 25178, and ISO 1302. You can check online courses on udemy and coursera, also there are plenty of research papers and books for learning this domain.
China tuofa CNC experts also provide you with the facility of surface finishing. It is divided into two types, one is achieved through removal of material and other is carried out by adding a layer of coating. Following processes are used:
- Bead Blasting
- Anodizing
- Electroplating
- Powder coating
- Polishing
- Brushing
- Black oxide
- Alodine
- Part making
FAQs
Weld is the method used to achieve the surface finish?
No, welding is not done for the purpose of achieving surface finish. Welding is a joining process where two metals are fused together. Surface finish is the result of various processes like grinding, polishing, or coating. Weld can be present on the surface of metal or an alloy but it doesn’t mean that it is used for this purpose.
What is a 125-surface finish?
A 125-surface finish specifies that the surface has been machined to achieve an average roughness value of 125 microinches (µin) or about 3.2 micrometers (µm). This finish is associated with smooth surfaces right for specific engineering applications.
Fine quality surface finish is produced in?
 Tel/WeChat:
  Email:
 Home
Home
 Aluminum 6061 T6 vs T651 vs T6511: What is the Difference?


